T2D multi-omics causal analysis#
This tutorial applies CauTrigger to single-cell multi-omics data from pancreatic islets of healthy, pre-diabetic, and T2D individuals. The analysis models hierarchical transcriptional regulation from transcription factors (TFs) → cis-regulatory elements (CREs) → target genes (TGs) → T2D state.
Steps include:
Identifying T2D-related TGs from scRNA-seq data.
Inferring upstream CRE–TG relationships using scATAC-seq data.
Integrating TF–CRE–TG modules to reveal causal transcriptional hierarchies.
Performing in silico activation of key TFs (e.g., FOS, JUN) to assess potential regulatory recovery effects.
import os
import math
import numpy as np
import pandas as pd
import matplotlib.pyplot as plt
import seaborn as sns
from itertools import combinations
from sklearn.preprocessing import normalize, minmax_scale
from scipy.stats import pearsonr, spearmanr, f_oneway, norm
import warnings
warnings.filterwarnings("ignore")
plt.rcParams['pdf.fonttype'] = 42
plt.rcParams['font.sans-serif'] = ['Arial']
plt.rcParams['font.family'] = 'sans-serif'
import logging
logging.getLogger('matplotlib.font_manager').disabled = True
import scanpy as sc
import torch
import torch.nn as nn
# torch.cuda.set_device(1)
# import pybedtools
from sklearn.metrics import (
    average_precision_score,
    roc_auc_score,
    f1_score,
    precision_score,
    recall_score
)
from scipy.sparse import load_npz
from scipy.sparse import coo_matrix
from scipy.io import mmread

from cautrigger.utils import set_seed, pert_plot_vector_field
from cautrigger.model import CauTrigger3L, CauTrigger2L, CauTrigger1L
set_seed(42)
data_dir = os.path.join("..", "data/")
output_dir = os.path.join("..", "output/")
os.makedirs(output_dir, exist_ok=True)
TF = pd.read_csv(os.path.join(data_dir, 'filtered_TF_pseudobulk.csv'), index_col=0).T
RE = pd.read_csv(os.path.join(data_dir, 'filtered_RE_pseudobulk.csv'), index_col=0).T
TG = pd.read_csv(os.path.join(data_dir, 'filtered_TG_pseudobulk.csv'), index_col=0).T
# TG--RE interaction matrix
sparse_matrix = load_npz(os.path.join(data_dir, "TG_RE_interaction_matrix.npz"))
sparse_matrix_index = pd.read_csv(os.path.join(data_dir, "TG_RE_interaction_matrix_rows.txt")).values.flatten()
sparse_matrix_column = pd.read_csv(os.path.join(data_dir, "TG_RE_interaction_matrix_cols.txt")).values.flatten()
t2d_samples = ["C0019", "C0024", "C0021", "A0024", "A0031", "C0023"]
pre_samples = ["A0011", "A0028", "A0029", "C0013", "C0014", "A0030", "A0021", "C0022"]
control_samples = ["C0026", "C0027", "A0019", "A0033", "A0027", "C0025"]

barcodes = pd.read_csv(data_dir + 'beta_RNA.barcodes', header=None)
barcodes[['sample_id', 'cell_barcode']] = barcodes[0].str.split('_', expand=True)
barcodes['state'] = [
    'control' if a in control_samples else
    'pre' if a in pre_samples else
    't2d' for a in barcodes['sample_id']
]
barcodes = barcodes.set_index(0)
filtered_barcodes = barcodes.loc[TF.index]

aligned_values = filtered_barcodes.state.values
from sklearn.preprocessing import LabelEncoder
label_encoder = LabelEncoder()
numeric_values = label_encoder.fit_transform(aligned_values)

label_map = pd.DataFrame({
    "celltype": label_encoder.classes_,
    "label": np.arange(len(label_encoder.classes_))
})
celltypes = label_encoder.classes_
set_seed(42)
Run CauTrigger on TF–CRE–TG structures#
adata1 = sc.AnnData(X=np.array(TG))
adata1.var_names = np.array(TG.columns)
adata1.obs_names = np.array(TG.index)
adata1.obs["labels"] = numeric_values
adata1.obs["celltype"] = aligned_values

model321_1 = CauTrigger1L(
    adata1,
    n_latent=10,
    n_hidden=128,
    n_state=len(np.unique(aligned_values)),
    n_layers_encoder=0,
    n_layers_decoder=0,
    n_layers_dpd=0,
    dropout_rate_encoder=0.0,
    dropout_rate_decoder=0.0,
    dropout_rate_dpd=0.0,
    use_batch_norm='none',
    use_batch_norm_dpd=True,
    decoder_linear=False,
    dpd_linear=False,
    init_thresh=0.00,
    attention=False,
    att_mean=False,
)
model321_1.train(max_epochs=300, batch_size=32, stage_training=True, weight_scheme="pbmc")
weight_df_weight1 = model321_1.get_up_feature_weights(normalize=True, method="Grad", sort_by_weight=False)
causal_factors_layer1_indices = np.argsort(weight_df_weight1[0]['weight'])[-1000:][::-1]

adata2 = sc.AnnData(RE)
adata2.var_names = np.array(RE.columns)
adata2.obs_names = np.array(RE.index)
adata2.obs["labels"] = numeric_values
adata2.obs["celltype"] = aligned_values
adata2.obsm['X_down'] = adata1.X[:, causal_factors_layer1_indices]
adata2.uns['TG_names'] = adata1[:, causal_factors_layer1_indices].var_names.values
model321_2 = CauTrigger2L(
    adata2,
    n_latent=10,
    n_hidden=128,
    n_state=len(np.unique(aligned_values)),
    n_layers_encoder=0,
    n_layers_decoder=0,
    n_layers_dpd=0,
    dropout_rate_encoder=0.0,
    dropout_rate_decoder=0.0,
    dropout_rate_dpd=0.0,
    use_batch_norm='none',
    use_batch_norm_dpd=True,
    decoder_linear=False,
    dpd_linear=False,
    init_thresh=0.00,
    attention=False,
    att_mean=False,
)

model321_2.train(max_epochs=300, batch_size=32, stage_training=True, weight_scheme="pbmc")
weight_df_weight2 = model321_2.get_up_feature_weights(normalize=True, method="Grad", sort_by_weight=False)
causal_factors_layer2_indices = np.argsort(weight_df_weight2[0]['weight'])[-5000:][::-1]

adata3 = sc.AnnData(TF)
adata3.var_names = np.array(TF.columns)
adata3.obs_names = np.array(TF.index)
adata3.obs["labels"] = numeric_values
adata3.obs["celltype"] = aligned_values
adata3.obsm['X_down2'] = adata2.obsm['X_down'].copy()
adata3.obsm['X_down1'] = adata2.X[:, causal_factors_layer2_indices]
adata3.uns['TG_names'] = adata2.uns['TG_names'].copy()
adata3.uns['RE_names'] = adata2[:, causal_factors_layer2_indices].var_names.values
model321_3 = CauTrigger3L(
    adata3,
    n_latent=10,
    n_hidden=128,
    n_state=len(np.unique(aligned_values)),
    n_layers_encoder=0,
    n_layers_decoder=0,
    n_layers_dpd=0,
    dropout_rate_encoder=0.0,
    dropout_rate_decoder=0.0,
    dropout_rate_dpd=0.0,
    use_batch_norm='none',
    use_batch_norm_dpd=True,
    decoder_linear=False,
    dpd_linear=False,
    init_thresh=0.00,
    attention=False,
    att_mean=False,
    decoder_down2_sparse=False,
)
model321_3.train(max_epochs=300, batch_size=32, stage_training=True, weight_scheme="pbmc")
adata_tg = sc.AnnData(X=np.array(pd.concat([TF,RE,TG], axis=1)))
adata_tg.obs["celltype"] = aligned_values
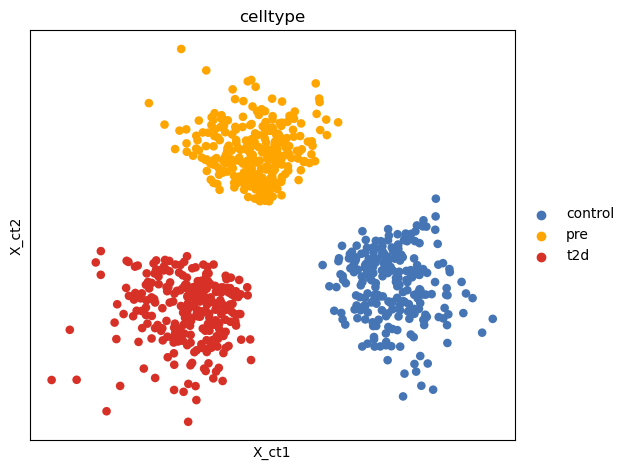
adata_tg.obsm['X_ct'] = model321_3.get_model_output()['latent'][:, :2][:, [1, 0]]
sc.pl.embedding(adata_tg, basis='X_ct', color='celltype', show=False, palette = {"control": "#4575B4", "pre": "orange", 't2d': '#D73027'})
plt.tight_layout()
plt.savefig(output_dir + 'tg_Z.pdf')
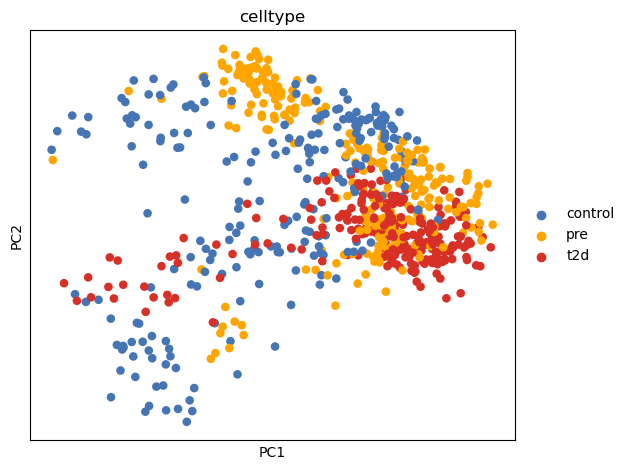
# PCA
sc.tl.pca(adata_tg)
sc.pl.pca(adata_tg, color='celltype', show=False, palette = {"control": "#4575B4", "pre": "orange", 't2d': '#D73027'})
plt.tight_layout()
# plt.savefig(output_dir + 'tg_PCA.pdf')
adata_TF = adata3.copy()
adata_down = sc.AnnData(adata3.obsm['X_down2'])
adata_down.var_names = adata3.uns['TG_names']
adata_down.obs_names = TG.index.values
adata_down.obs = adata_TF.obs.copy()
adata_down.obsm['X_ct'] = model321_3.get_model_output()['latent'][:, :2][:, [1, 0]]
dot_size = None
pert_Gene = ['FOS', 'JUN']
fold = [20, 20]
pert_plot_vector_field(
adata_TF=adata_TF,
adata_down=adata_down,
model=model321_3,
pert_Gene=pert_Gene,
pert_celltype=['t2d'], # perturbation applied to T2D samples
fold=fold,
state_obs='celltype',
n_neighbors=None,
scale=30,
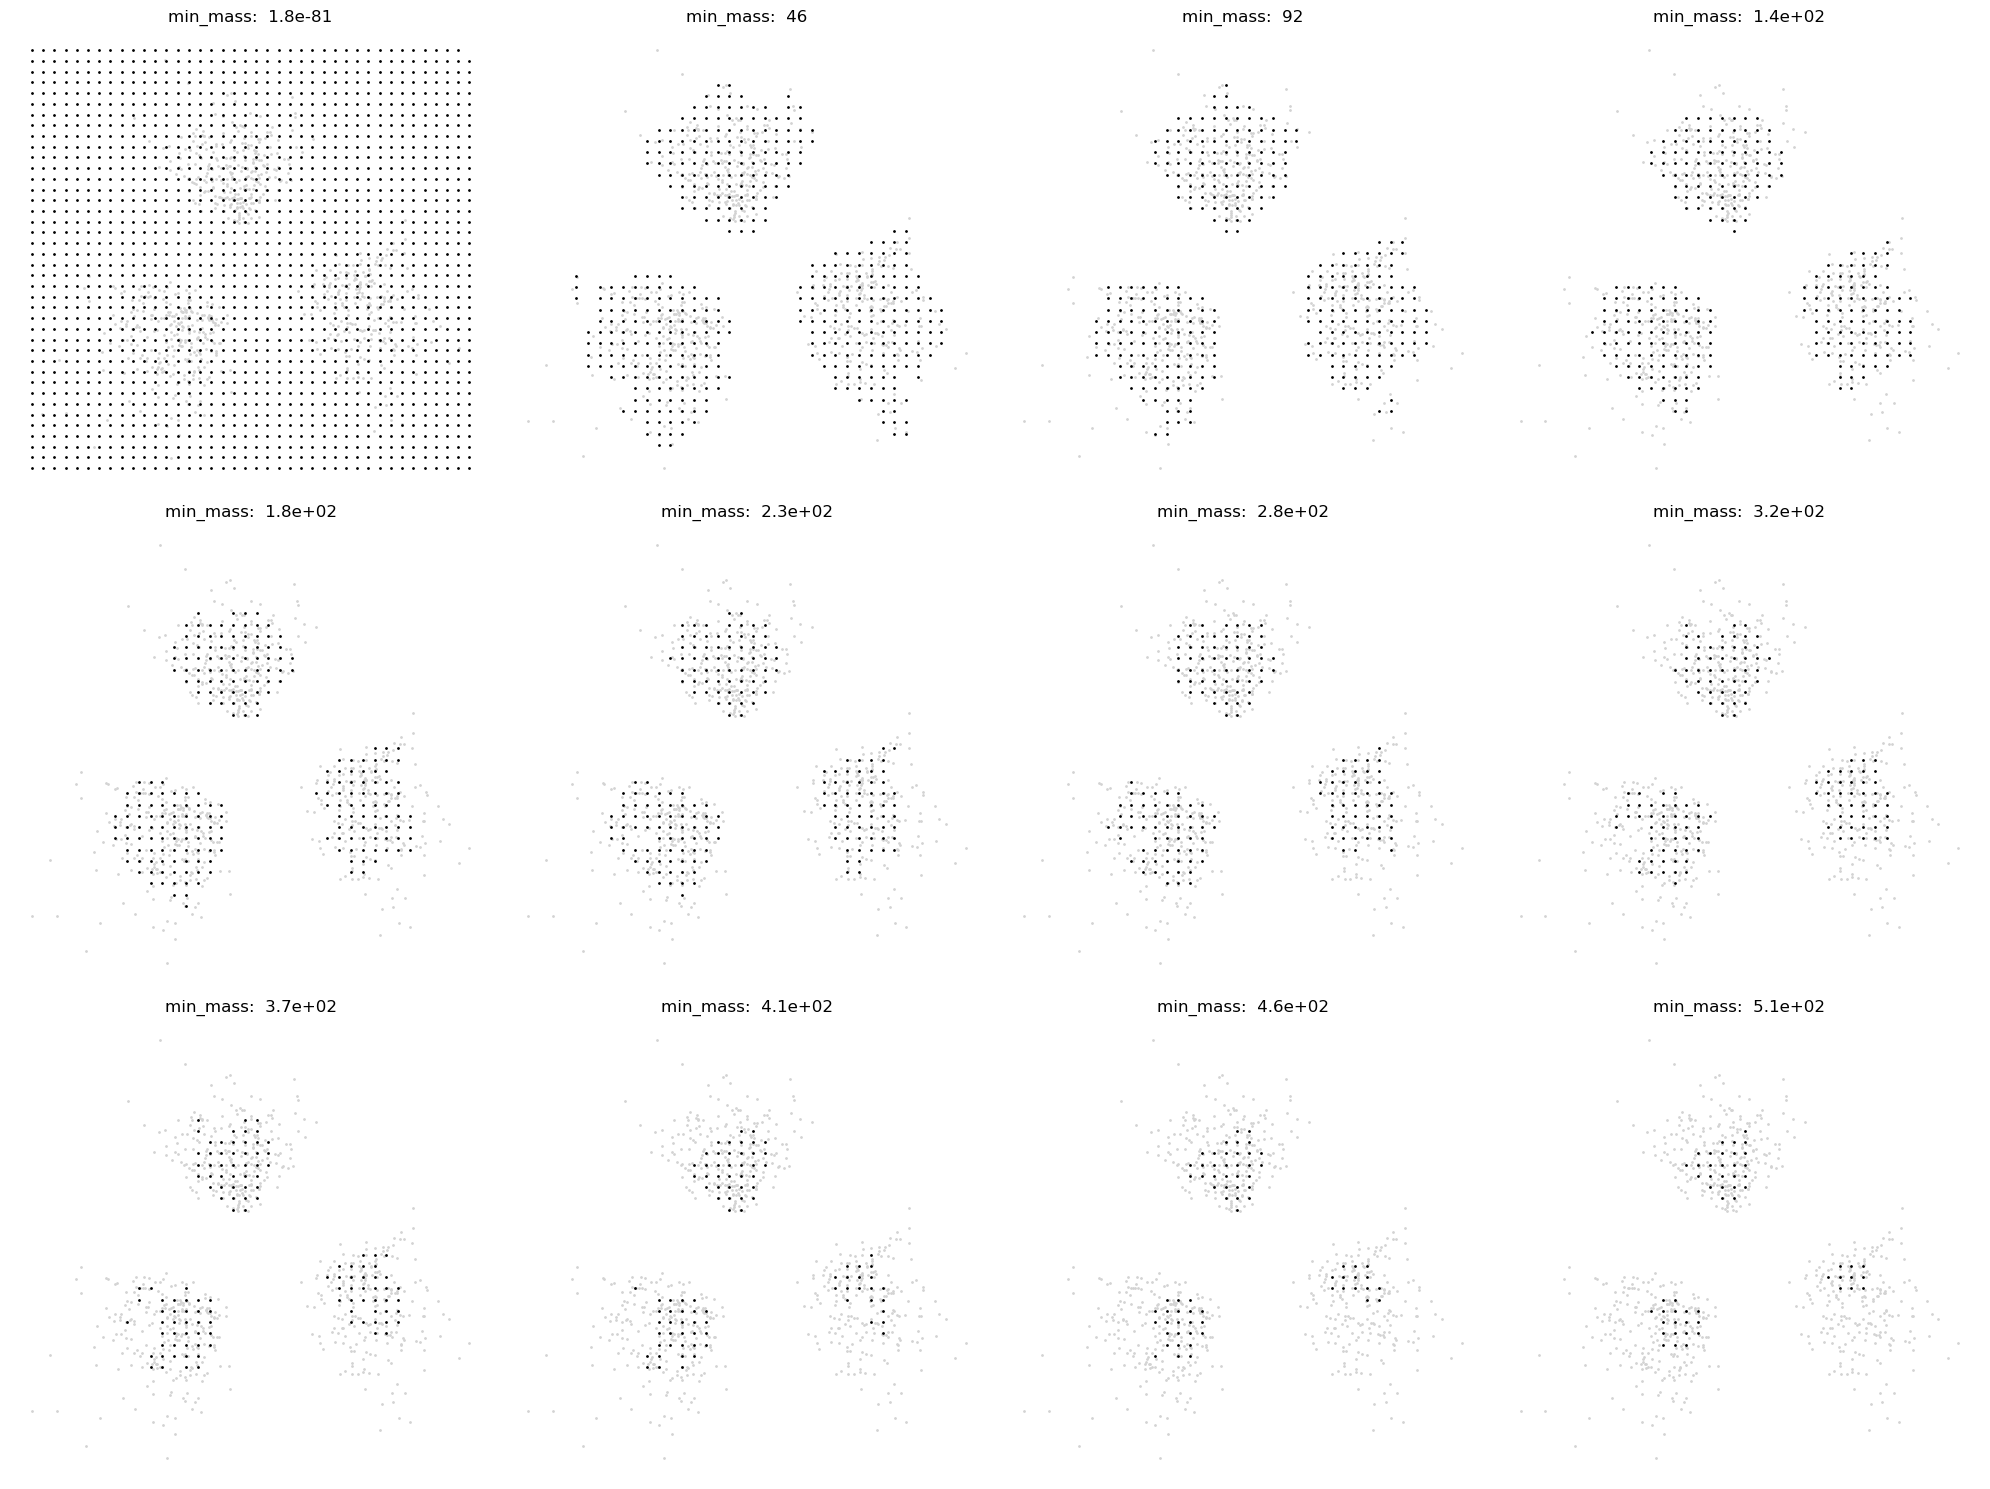
run_suggest_mass_thresholds=True,
dot_size=dot_size,
min_mass=1.3,
embedding_name='X_ct'
)
{'latent': array([[0.35976222, 0.60128593, 0.9952867 , ..., 0.6821408 , 0.43624187,
         0.74404114],
        [0.36014   , 0.65534127, 1.0023377 , ..., 0.6937659 , 0.44885802,
         0.79042304],
        [0.39414886, 0.6574092 , 0.9953942 , ..., 0.6631692 , 0.47129157,
         0.7673505 ],
        ...,
        [0.37424102, 0.8259491 , 0.9844584 , ..., 0.6721867 , 0.43968883,
         0.7678825 ],
        [0.37770766, 0.8230328 , 0.9231202 , ..., 0.6475022 , 0.42355025,
         0.72056276],
        [0.42914638, 0.81321156, 0.96441627, ..., 0.65043944, 0.43554533,
         0.75407183]], dtype=float32),
 'logits': array([[-0.33242223,  0.5190135 , -0.75700474],
        [-0.3014224 ,  0.50748223, -0.7830999 ],
        [-0.3059253 ,  0.5159052 , -0.791774  ],
        ...,
        [-0.2359322 ,  0.4852621 , -0.84146655],
        [-0.237067  ,  0.48637223, -0.841771  ],
        [-0.24069667,  0.49775538, -0.8577024 ]], dtype=float32),
 'probs': array([[0.25018442, 0.58618426, 0.16363132],
        [0.25885323, 0.5812412 , 0.1599056 ],
        [0.25708032, 0.58477026, 0.15814936],
        ...,
        [0.27757183, 0.57093424, 0.15149392],
        [0.2771813 , 0.5714123 , 0.15140642],
        [0.27531135, 0.5761423 , 0.14854634]], dtype=float32),
 'preds': array([[0, 1, 0],
        [0, 1, 0],
        [0, 1, 0],
        ...,
        [0, 1, 0],
        [0, 1, 0],
        [0, 1, 0]]),
 'x_down1_rec_alpha': array([[0.        , 0.        , 0.        , ..., 0.11940607, 0.        ,
         0.        ],
        [0.        , 0.        , 0.        , ..., 0.12109909, 0.        ,
         0.        ],
        [0.        , 0.        , 0.        , ..., 0.11877635, 0.        ,
         0.        ],
        ...,
        [0.        , 0.        , 0.        , ..., 0.13129735, 0.        ,
         0.        ],
        [0.        , 0.        , 0.        , ..., 0.13052353, 0.        ,
         0.        ],
        [0.        , 0.        , 0.        , ..., 0.12574235, 0.        ,
         0.        ]], dtype=float32),
 'x_down2_rec_alpha': array([[0., 0., 0., ..., 0., 0., 0.],
        [0., 0., 0., ..., 0., 0., 0.],
        [0., 0., 0., ..., 0., 0., 0.],
        ...,
        [0., 0., 0., ..., 0., 0., 0.],
        [0., 0., 0., ..., 0., 0., 0.],
        [0., 0., 0., ..., 0., 0., 0.]], dtype=float32)}
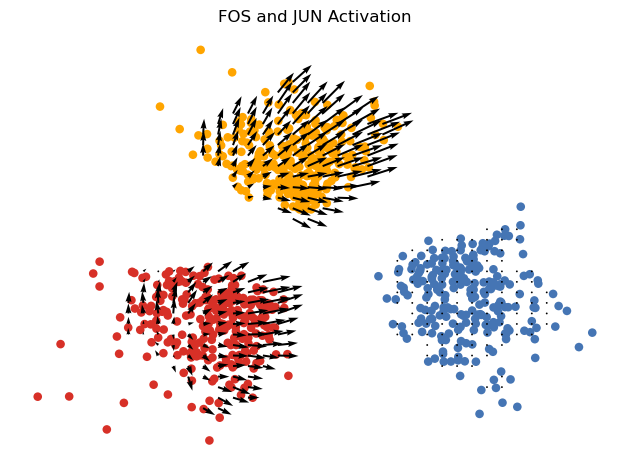
model_output_pert = pert_plot_vector_field(
    adata_TF=adata_TF,
    adata_down=adata_down,
    model=model321_3,
    pert_Gene=pert_Gene,
    pert_celltype=['t2d', 'pre'],      # apply perturbation to T2D + Pre-T2D groups
    fold=fold,
    state_obs='celltype',
    n_neighbors=None,
    scale=30,
    run_suggest_mass_thresholds=False,
    dot_size=None,
    min_mass=92,                       # threshold for vector field mass
    embedding_name='X_ct',
    palette={"control": "#4575B4", "pre": "orange", "t2d": "#D73027"},
    save_dir=output_dir,
    direction='Activation'
)
tftg_score = model321_3.get_3to1_ig(celltype='t2d')
tftg_score = tftg_score.mean(0)
tftg_score_df = pd.DataFrame(tftg_score, index=TF.columns.values, columns=adata3.uns['TG_names'])
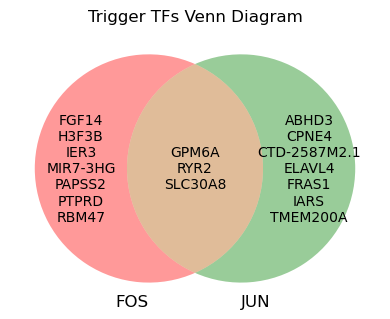
tftg_score_df.loc['FOS', tftg_score_df.loc['FOS'].abs().sort_values(ascending=False).index][:10].index.values
array(['HS6ST3', 'G6PC2', 'TTR', 'PAPSS2', 'H3F3B', 'MT1E', 'LRRTM3',
       'FGF14', 'PPM1E', 'ELAVL4'], dtype=object)
tftg_score_df.loc['JUN', tftg_score_df.loc['JUN'].abs().sort_values(ascending=False).index][:10].index.values
array(['SLC30A8', 'CPNE4', 'EGFEM1P', 'SOX5', 'FGF14', 'ESRRG', 'RYR2',
       'RASGRF2', 'ELAVL4', 'NAV2'], dtype=object)
from matplotlib_venn import venn2_unweighted

fos = set(['PAPSS2', 'GPM6A', 'MIR7-3HG', 'FGF14', 'SLC30A8', 'RBM47',
       'H3F3B', 'PTPRD', 'RYR2', 'IER3'])
jun = set(['SLC30A8', 'GPM6A', 'RYR2', 'CTD-2587M2.1', 'ELAVL4', 'ABHD3',
       'IARS', 'FRAS1', 'CPNE4', 'TMEM200A'])


plt.figure(figsize=(4, 4))
v = venn2_unweighted([fos, jun], set_labels=('FOS', 'JUN'))

regions = {
    '10': fos - jun,
    '01': jun - fos,
    '11': fos & jun
}

for region_id, genes in regions.items():
    label = v.get_label_by_id(region_id)
    if label:
        gene_text = '\n'.join(sorted(genes)) if genes else ''
        label.set_text(gene_text)

plt.title("Trigger TFs Venn Diagram")
plt.tight_layout()
plt.savefig(os.path.join(output_dir, 'TG_venn.pdf'))
plt.show()
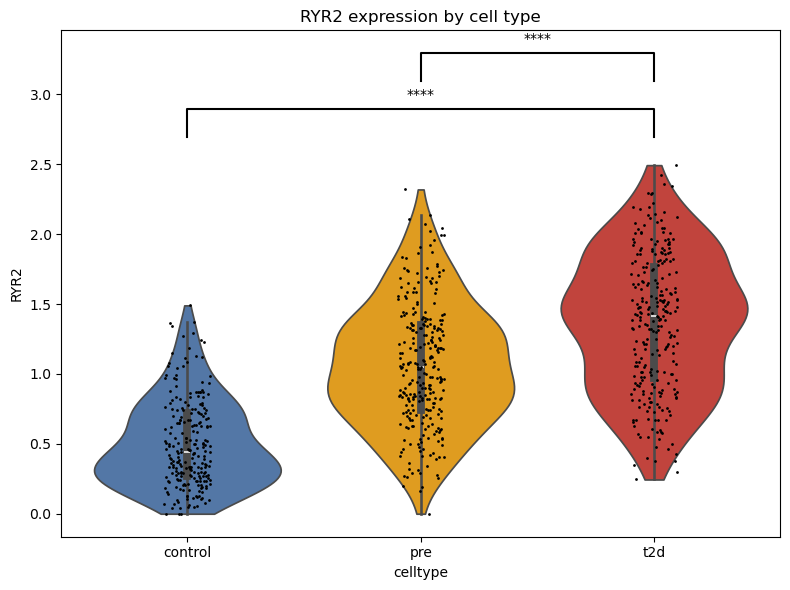
Draw expression violin plot#
import pandas as pd
import seaborn as sns
import matplotlib.pyplot as plt
from scipy.stats import ttest_ind


gene = 'RYR2'
expr = adata_down[:, gene].X.toarray().flatten()
celltype = adata_down.obs['celltype'].values

df = pd.DataFrame({f'{gene}': expr, 'celltype': celltype})

plt.figure(figsize=(8, 6))
ax = sns.violinplot(data=df, x='celltype', y=gene, inner='box', cut=0, palette = {"control": "#4575B4", "pre": "orange", 't2d': '#D73027'})
sns.stripplot(data=df, x='celltype', y=gene, color='k', size=2, jitter=True)

group1 = df[df['celltype'] == 'control'][gene]
group2 = df[df['celltype'] == 'pre'][gene]
group3 = df[df['celltype'] == 't2d'][gene]

def get_significance(p):
    if p < 0.0001:
        return '****'
    elif p < 0.001:
        return '***'
    elif p < 0.01:
        return '**'
    elif p < 0.05:
        return '*'
    else:
        return 'ns'

_, pval_13 = ttest_ind(group1, group3, equal_var=False)
_, pval_23 = ttest_ind(group2, group3, equal_var=False)
sig_13 = get_significance(pval_13)
sig_23 = get_significance(pval_23)

y_max = df[gene].max()
h = 0.2
col = 'k'

# 1 vs 3
x1, x3 = 0, 2
plt.plot([x1, x1, x3, x3], [y_max+0.2, y_max+0.4, y_max+0.4, y_max+0.2], lw=1.5, c=col)
plt.text((x1+x3)*.5, y_max+0.45, sig_13, ha='center', va='bottom', color=col)

# 2 vs 3
x2 = 1
plt.plot([x2, x2, x3, x3], [y_max+0.6, y_max+0.8, y_max+0.8, y_max+0.6], lw=1.5, c=col)
plt.text((x2+x3)*.5, y_max+0.85, sig_23, ha='center', va='bottom', color=col)

plt.title(f"{gene} expression by cell type")
plt.tight_layout()
plt.savefig(output_dir + f'{gene}_violin.pdf')
plt.show()
Fetch CRE-TG pairs and draw arc plot in R using ‘cicero’#
row = sparse_matrix.toarray()[np.where(sparse_matrix_index == 'SLC30A8')[0][0], :]
nonzero_indices = np.where(row != 0)[0]
sparse_matrix_column[nonzero_indices]
array(['8:117745068-117745568', '8:117962120-117962620'], dtype=object)
np.isin(sparse_matrix_column[nonzero_indices], adata3.uns['RE_names'])
array([ True, False])
geneanno = pd.read_csv(os.path.join(data_dir, 'hg19_geneanno.txt'), sep='\t')
geneanno = geneanno.drop_duplicates(subset=['Gene name'])
geneanno.loc[geneanno['Gene name'] == 'SLC30A8', :]
| Gene stable ID | Transcript stable ID | Chromosome/scaffold name | Gene start (bp) | Gene end (bp) | Strand | Gene name | Transcription start site (TSS) | |
|---|---|---|---|---|---|---|---|---|
| 170716 | ENSG00000164756 | ENST00000521243 | 8 | 117962512 | 118188953 | 1 | SLC30A8 | 117962512 |
## code in R

# library(cicero)
# gene_annotation_sample1 <- data.frame(
#   chromosome = "chr8",
#   start = 117962512	,
#   end = 118188953,
#   strand = "+",
#   symbol = 'SLC30A8',
#   transcript = 'ENSG00000164756'
# )

# conns_df <- data.frame(
#   Peak1 = c('chr8_117745068_117745568', 'chr8_117962120_117962620'),
#   Peak2 = c('chr8_117962512_117962512', 'chr8_117962512_117962512'),
#   coaccess = c(1,1),
#   conn_color = c("green","green")
# )

# pdf("D:/CauTrigger_Project/CauTrigger-new/BenchmarkGRN/output/t2d/arc_plot_SLC30A8.pdf", width = 4, height = 3)
# plot_connections(conns_df, "chr8", 117962512-250000, 117962512+250000,
#                  gene_model = gene_annotation_sample1,
#                  peak_color = "conn_color",
#                  connection_color = "conn_color",
#                  connection_width = 1,
#                  gene_model_color = "#81D2C7",
#                  # viewpoint = "chr5_115910629_115910630",
#                  collapseTranscripts = "longest" )
# dev.off()