Gut–brain axis hierarchical analysis in autism spectrum disorder (ASD)#
This notebook applies CauTrigger to model hierarchical regulation along the gut–brain axis, from gut microbiota → host proteome → ASD-related neurodevelopmental states.
Steps include:
Identifying causal proteins associated with ASD from the host proteome layer.
Inferring upstream microbiota contributing to host variation and ASD states.
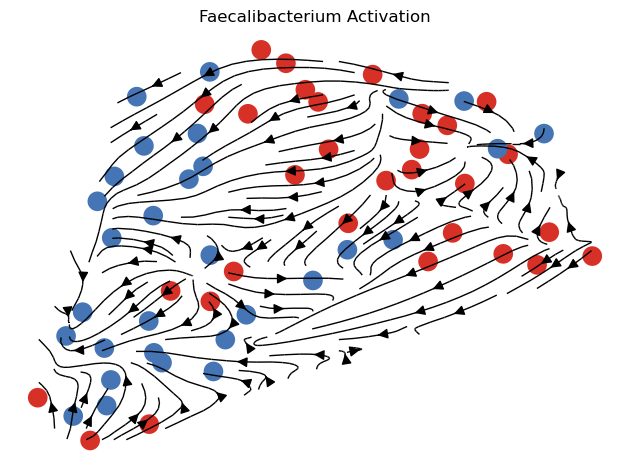
Performing in silico activation of key taxa (e.g., Faecalibacterium) to simulate microbiota-driven modulation.
Data source:Integrative multi-omics analysis of autism spectrum disorder reveals unique microbial macromolecules interactions.
Import and environment setup#
import os
import math
import numpy as np
import pandas as pd
import matplotlib.pyplot as plt
import seaborn as sns
from itertools import combinations
from sklearn.feature_selection import mutual_info_classif
from sklearn.svm import SVC
from sklearn.ensemble import RandomForestClassifier
from sklearn.preprocessing import normalize, minmax_scale
from scipy.stats import pearsonr, spearmanr, f_oneway, norm
import warnings
warnings.filterwarnings("ignore")
plt.rcParams['pdf.fonttype'] = 42
plt.rcParams['font.sans-serif'] = ['Arial']
plt.rcParams['font.family'] = 'sans-serif'
import logging
logging.getLogger('matplotlib.font_manager').disabled = True
import scanpy as sc
import torch
import torch.nn as nn
torch.cuda.set_device(0)
import re
from sklearn.preprocessing import FunctionTransformer

from cautrigger.utils import set_seed, pert_plot_stream
from cautrigger.model import CauTrigger1L, CauTrigger2L
Load and preprocess data#
data_dir = '../data/'
output_dir = '../output/'
os.makedirs(output_dir, exist_ok=True)
microb_df = pd.read_csv(os.path.join(data_dir, '16sRNA.csv'), index_col=0).fillna(0)
microb_df = microb_df.iloc[np.where(np.sum(microb_df.T != 0) >= 6)[0], :]
microb = minmax_scale(microb_df)
microb_df.iloc[:] = microb
prot = pd.read_csv(os.path.join(data_dir, 'host_Proteomics.csv'), index_col=0)
def reorder_column_name(col):
    match = re.match(r"(\d+)([A-Z])", col)
    if match:
        return match.group(2) + match.group(1)
    else:
        return col

prot.columns = [reorder_column_name(col) for col in prot.columns]


def sort_key(col):
    match = re.match(r"([A-Z])(\d+)", col)
    if match:
        return (match.group(1), int(match.group(2)))
    return (col, 0)


sorted_columns = sorted(prot.columns, key=sort_key)
prot = prot[sorted_columns]
labels = prot.loc['Label']
prot_df = prot.iloc[1:]
prot = minmax_scale(prot_df)
prot_df.iloc[:] = prot
Train CauTrigger (Microbiota → Proteome → ASD)#
set_seed(42)
adata_layer1 = sc.AnnData(X=np.array(prot, dtype=np.float32).T)
adata_layer1.obs_names = prot_df.columns
adata_layer1.var_names = prot_df.index
adata_layer1.obs['labels_ori'] = labels.values
adata_layer1.obs['labels'] = labels.apply(lambda tg: 1 if tg == labels[0] else 0)

model_1L = CauTrigger1L(
    adata_layer1,
    n_latent=10,
    n_hidden=128,
    n_layers_encoder=0,
    n_layers_decoder=0,
    n_layers_dpd=0,
    dropout_rate_encoder=0.0,
    dropout_rate_decoder=0.0,
    dropout_rate_dpd=0.0,
    use_batch_norm='none',
    use_batch_norm_dpd=True,
    decoder_linear=True,
    dpd_linear=False,
    init_weight=None,
    init_thresh=0.0,
    attention=False,
    att_mean=False,
)
model_1L.train(max_epochs=300, stage_training=True)
df_layer1, _ = model_1L.get_up_feature_weights(method='SHAP', sort_by_weight=False)
topk_indices = df_layer1["weight"].values.argsort()[-100:]
X_down = adata_layer1[:, topk_indices]

adata_layer2 = sc.AnnData(
    X=microb.T,
    obsm={"X_down": X_down.X.toarray()}
)
adata_layer2.obs_names = microb_df.columns
adata_layer2.var_names = microb_df.index
adata_layer2.obs['labels_ori'] = labels.values
adata_layer2.obs['labels'] = labels.apply(lambda tg: 1 if tg == labels[0] else 0)

model_2L = CauTrigger2L(
    adata_layer2,
    n_latent=10,
    n_hidden=128,
    n_layers_encoder=0,
    n_layers_decoder=0,
    n_layers_dpd=0,
    dropout_rate_encoder=0.0,
    dropout_rate_decoder=0.0,
    dropout_rate_dpd=0.0,
    use_batch_norm='none',
    use_batch_norm_dpd=True,
    decoder_linear=True,
    dpd_linear=True,
    init_weight=None,
    init_thresh=0.0,
    attention=False,
    att_mean=False,
)
model_2L.train(max_epochs=300, stage_training=True)
df_layer2, _ = model_2L.get_up_feature_weights(method='SHAP', sort_by_weight=True)
Information flow and downstream analyses#
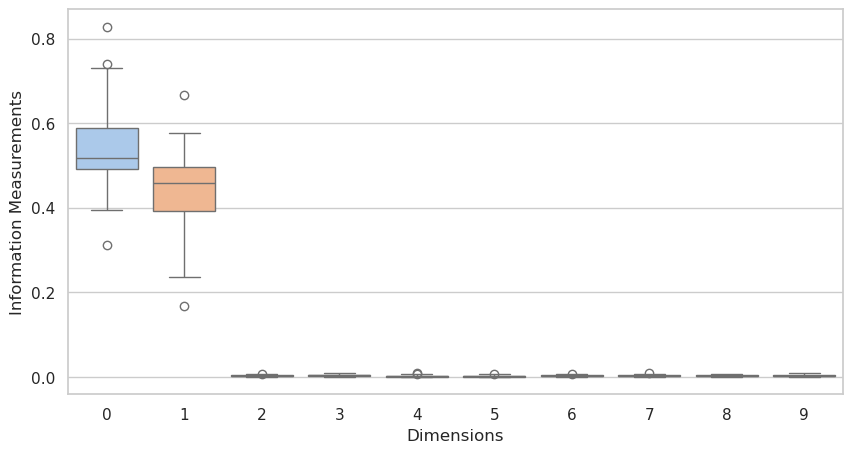
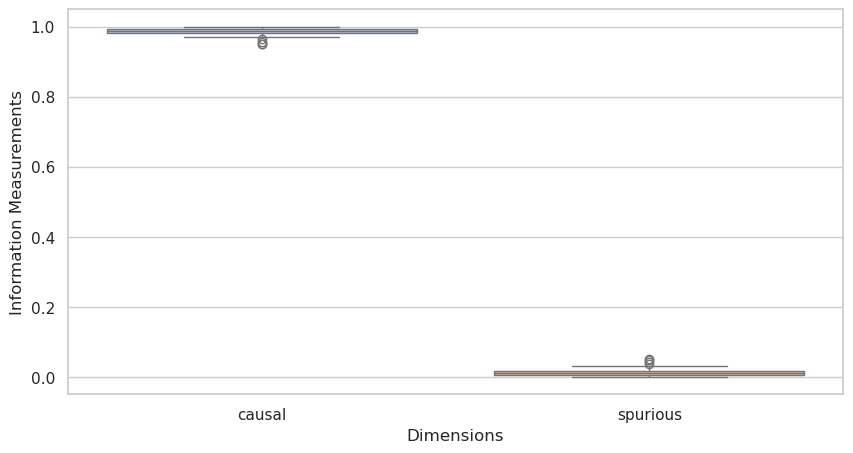
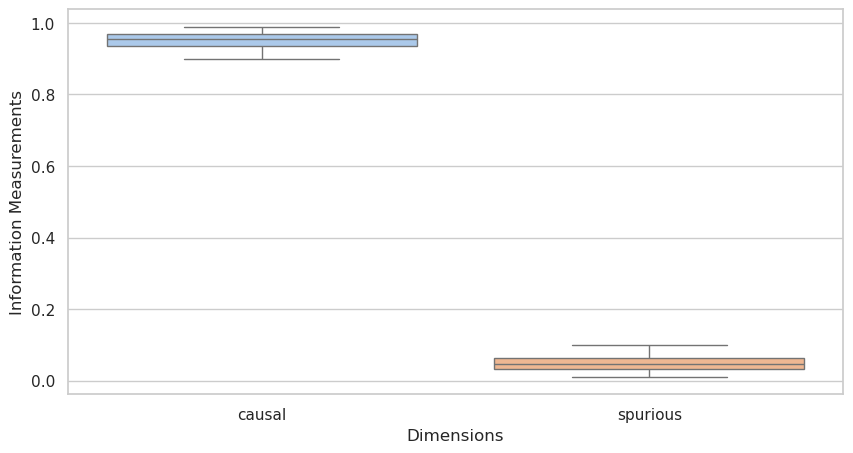
model_1L.compute_information_flow(plot_info_flow=True, save_fig=True, save_dir=output_dir)
(            0         1         2         3         4         5         6  \
 A1   0.524907  0.451544  0.002385  0.004177  0.002489  0.001596  0.004022
 A2   0.597220  0.364063  0.005251  0.006858  0.002189  0.002709  0.005120
 A3   0.457608  0.516787  0.002057  0.003200  0.001806  0.002857  0.002893
 A4   0.509703  0.461390  0.003265  0.004623  0.002165  0.002186  0.004340
 A5   0.598944  0.381025  0.003355  0.003202  0.001371  0.002343  0.001705
 A6   0.739513  0.251651  0.001365  0.002118  0.000341  0.000453  0.000590
 A7   0.598032  0.388858  0.003271  0.002092  0.000582  0.000569  0.000979
 A8   0.394622  0.575781  0.002056  0.003695  0.003354  0.003242  0.003407
 A9   0.616491  0.380930  0.000464  0.000402  0.000180  0.000092  0.000291
 A10  0.674995  0.297843  0.003504  0.006259  0.001081  0.000890  0.001446
 A11  0.662705  0.327885  0.002326  0.002798  0.000401  0.000703  0.000456
 A12  0.479497  0.513900  0.000812  0.001296  0.000524  0.000338  0.000470
 A13  0.506226  0.474587  0.001150  0.003126  0.002709  0.001463  0.002801
 A14  0.514751  0.449148  0.003233  0.008091  0.003575  0.002944  0.003039
 A15  0.545012  0.420327  0.002756  0.008703  0.001983  0.002700  0.002692
 A16  0.515123  0.463639  0.001529  0.003154  0.002396  0.002173  0.002414
 A17  0.517114  0.453305  0.003447  0.003490  0.003144  0.002575  0.002526
 A18  0.731172  0.236862  0.002316  0.006029  0.003218  0.005663  0.003136
 A19  0.608099  0.363016  0.004199  0.005422  0.002667  0.001966  0.002288
 A20  0.564350  0.392190  0.005515  0.006580  0.004226  0.002846  0.006098
 A21  0.581593  0.382785  0.004876  0.008387  0.003283  0.003287  0.006357
 A22  0.451459  0.520891  0.003442  0.003021  0.002460  0.002613  0.003111
 A23  0.478778  0.494034  0.004856  0.003241  0.001634  0.002632  0.002445
 A24  0.467127  0.500384  0.003640  0.007487  0.004517  0.003520  0.002614
 A25  0.828035  0.166798  0.000668  0.001723  0.000271  0.000205  0.000347
 A26  0.586770  0.378625  0.004891  0.006191  0.006349  0.003232  0.003072
 A27  0.535537  0.427484  0.004602  0.004798  0.005901  0.004095  0.004803
 A28  0.645411  0.297264  0.007508  0.006265  0.008294  0.005999  0.006878
 A29  0.491445  0.480606  0.002988  0.005452  0.003734  0.003365  0.003354
 A30  0.501783  0.472566  0.002253  0.003213  0.001808  0.002841  0.004887
 C1   0.469132  0.509451  0.002599  0.004121  0.002822  0.002628  0.002282
 C2   0.640206  0.359567  0.000015  0.000028  0.000022  0.000019  0.000037
 C3   0.497838  0.497447  0.000436  0.000782  0.000525  0.000458  0.000714
 C4   0.559726  0.438930  0.000111  0.000177  0.000193  0.000165  0.000214
 C5   0.555440  0.439174  0.000359  0.001122  0.000675  0.000636  0.000531
 C6   0.508630  0.490838  0.000097  0.000063  0.000078  0.000043  0.000076
 C7   0.591296  0.400860  0.000537  0.001528  0.000905  0.000519  0.001621
 C8   0.518065  0.455951  0.003173  0.004190  0.002119  0.001928  0.003501
 C9   0.311615  0.665736  0.002836  0.004116  0.002229  0.002517  0.003873
 C10  0.470567  0.506557  0.001379  0.004261  0.002567  0.001787  0.001789
 C11  0.598464  0.401480  0.000003  0.000008  0.000009  0.000008  0.000009
 C12  0.542859  0.456904  0.000014  0.000023  0.000037  0.000045  0.000026
 C13  0.496678  0.489451  0.001788  0.002987  0.002657  0.000702  0.001487
 C14  0.518680  0.474970  0.000576  0.001245  0.001086  0.000672  0.000699
 C15  0.511998  0.478814  0.000835  0.001491  0.000871  0.001291  0.001581
 C16  0.458549  0.533879  0.000823  0.000607  0.001438  0.000950  0.000722
 C17  0.471724  0.527348  0.000059  0.000110  0.000205  0.000078  0.000080
 C18  0.533720  0.458726  0.000843  0.001375  0.000850  0.001235  0.000995
 C19  0.538224  0.451261  0.000675  0.001354  0.001544  0.001259  0.001573
 C20  0.499987  0.499520  0.000021  0.000068  0.000099  0.000041  0.000057
 C21  0.499359  0.495956  0.000675  0.000650  0.000746  0.000358  0.000451
 C22  0.532167  0.463187  0.000387  0.000754  0.000514  0.000395  0.000836
 C23  0.489523  0.487323  0.002786  0.003353  0.002504  0.003293  0.002382
 C24  0.457938  0.540194  0.000078  0.000239  0.000234  0.000166  0.000310
 C25  0.598887  0.382977  0.002054  0.002898  0.003233  0.001840  0.001724
 C26  0.537830  0.445050  0.001861  0.002007  0.003601  0.001544  0.001989
 C27  0.463439  0.524999  0.001121  0.002082  0.001393  0.001650  0.001125
 C28  0.493460  0.490080  0.000852  0.003186  0.001768  0.001943  0.001585
 C29  0.464190  0.508526  0.003396  0.003379  0.003043  0.002067  0.003957
 C30  0.538707  0.436155  0.002559  0.004363  0.002164  0.001963  0.003036

             7         8         9
 A1   0.002092  0.003563  0.003225
 A2   0.004501  0.006037  0.006052
 A3   0.005641  0.002942  0.004209
 A4   0.003709  0.003524  0.005095
 A5   0.002680  0.001801  0.003575
 A6   0.000666  0.001586  0.001716
 A7   0.000834  0.001354  0.003427
 A8   0.004297  0.006167  0.003379
 A9   0.000437  0.000327  0.000386
 A10  0.002804  0.003297  0.007882
 A11  0.001132  0.000868  0.000726
 A12  0.001422  0.000792  0.000950
 A13  0.003638  0.002616  0.001683
 A14  0.007167  0.004085  0.003967
 A15  0.004474  0.004684  0.006669
 A16  0.003159  0.002478  0.003934
 A17  0.006042  0.004700  0.003658
 A18  0.002977  0.005370  0.003257
 A19  0.002657  0.003816  0.005871
 A20  0.007452  0.004825  0.005917
 A21  0.002791  0.003060  0.003581
 A22  0.002961  0.002990  0.007053
 A23  0.004245  0.003203  0.004931
 A24  0.003993  0.003596  0.003122
 A25  0.000532  0.000615  0.000808
 A26  0.003647  0.003466  0.003756
 A27  0.003434  0.003999  0.005346
 A28  0.008143  0.006795  0.007443
 A29  0.003435  0.002767  0.002855
 A30  0.003459  0.002532  0.004657
 C1   0.001172  0.003364  0.002430
 C2   0.000039  0.000049  0.000017
 C3   0.000619  0.000508  0.000673
 C4   0.000186  0.000152  0.000147
 C5   0.000832  0.000648  0.000583
 C6   0.000064  0.000037  0.000075
 C7   0.001104  0.000598  0.001033
 C8   0.003467  0.005217  0.002390
 C9   0.001598  0.001836  0.003645
 C10  0.005399  0.002425  0.003270
 C11  0.000005  0.000009  0.000004
 C12  0.000048  0.000025  0.000020
 C13  0.001419  0.001207  0.001624
 C14  0.000552  0.000956  0.000562
 C15  0.001425  0.001001  0.000692
 C16  0.001232  0.001081  0.000720
 C17  0.000095  0.000109  0.000193
 C18  0.000747  0.000813  0.000696
 C19  0.001093  0.002242  0.000775
 C20  0.000095  0.000062  0.000049
 C21  0.000590  0.000516  0.000699
 C22  0.000527  0.000654  0.000579
 C23  0.004038  0.002645  0.002153
 C24  0.000200  0.000223  0.000418
 C25  0.002238  0.001802  0.002347
 C26  0.002130  0.001693  0.002294
 C27  0.001799  0.001373  0.001018
 C28  0.002181  0.002332  0.002612
 C29  0.003460  0.003039  0.004942
 C30  0.002930  0.004656  0.003468  ,
        causal  spurious
 A1   0.950897  0.049103
 A2   0.984687  0.015313
 A3   0.983385  0.016615
 A4   0.986925  0.013075
 A5   0.992222  0.007778
 A6   0.982788  0.017212
 A7   0.978950  0.021050
 A8   0.974077  0.025923
 A9   0.997676  0.002324
 A10  0.956897  0.043103
 A11  0.988859  0.011141
 A12  0.996152  0.003848
 A13  0.986352  0.013648
 A14  0.974675  0.025325
 A15  0.976806  0.023194
 A16  0.987922  0.012078
 A17  0.983731  0.016269
 A18  0.989103  0.010897
 A19  0.950376  0.049624
 A20  0.983602  0.016398
 A21  0.989367  0.010633
 A22  0.979020  0.020980
 A23  0.976485  0.023515
 A24  0.982626  0.017374
 A25  0.995422  0.004578
 A26  0.985762  0.014238
 A27  0.994027  0.005973
 A28  0.992273  0.007727
 A29  0.981425  0.018575
 A30  0.964233  0.035767
 C1   0.988285  0.011715
 C2   0.999802  0.000198
 C3   0.991132  0.008868
 C4   0.999409  0.000591
 C5   0.990410  0.009590
 C6   0.999145  0.000855
 C7   0.993644  0.006356
 C8   0.970939  0.029061
 C9   0.990124  0.009876
 C10  0.974697  0.025303
 C11  0.999954  0.000046
 C12  0.999792  0.000208
 C13  0.991032  0.008968
 C14  0.997400  0.002600
 C15  0.988249  0.011751
 C16  0.990461  0.009539
 C17  0.999602  0.000398
 C18  0.992919  0.007081
 C19  0.991733  0.008267
 C20  0.999453  0.000547
 C21  0.994589  0.005411
 C22  0.998474  0.001526
 C23  0.984372  0.015628
 C24  0.999443  0.000557
 C25  0.993789  0.006211
 C26  0.990490  0.009510
 C27  0.993413  0.006587
 C28  0.988770  0.011230
 C29  0.970252  0.029748
 C30  0.992094  0.007906)
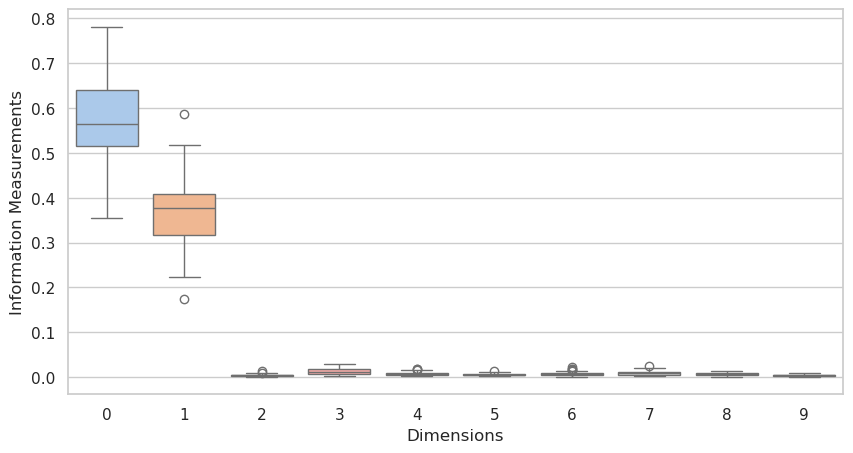
model_2L.compute_information_flow(plot_info_flow=True, save_fig=True, save_dir=output_dir)
(            0         1         2         3         4         5         6  \
 A1   0.630852  0.318585  0.003944  0.010081  0.008394  0.004038  0.005039
 A2   0.764985  0.223592  0.000991  0.002227  0.001554  0.001667  0.001201
 A3   0.724908  0.224540  0.003001  0.011070  0.007717  0.004274  0.007849
 A4   0.531217  0.370330  0.006179  0.016631  0.018012  0.011826  0.013029
 A5   0.584612  0.396728  0.001299  0.004230  0.002651  0.001875  0.002716
 A6   0.522168  0.390127  0.005233  0.017971  0.012055  0.006570  0.014431
 A7   0.483343  0.448730  0.005821  0.016985  0.010296  0.008155  0.004118
 A8   0.562059  0.381275  0.006224  0.014725  0.005924  0.007489  0.005646
 A9   0.579477  0.368723  0.006213  0.008844  0.007335  0.005332  0.003678
 A10  0.520144  0.390575  0.006226  0.023117  0.007767  0.011165  0.011706
 A11  0.661750  0.298141  0.003913  0.004610  0.006608  0.003019  0.004876
 A12  0.673785  0.283051  0.002476  0.010025  0.007173  0.003379  0.007528
 A13  0.630290  0.314376  0.003175  0.015003  0.005332  0.007056  0.005715
 A14  0.554140  0.342883  0.009950  0.028887  0.012746  0.008813  0.010348
 A15  0.605751  0.371448  0.002433  0.002343  0.004482  0.001948  0.003095
 A16  0.544656  0.383367  0.005408  0.015162  0.008359  0.007309  0.007341
 A17  0.569135  0.397980  0.003331  0.006159  0.004124  0.002287  0.007216
 A18  0.459906  0.452811  0.007125  0.014549  0.014591  0.006700  0.017078
 A19  0.512536  0.393885  0.005153  0.017646  0.014517  0.006019  0.014347
 A20  0.646742  0.285145  0.005748  0.018098  0.010754  0.007316  0.004383
 A21  0.526865  0.429176  0.003331  0.009318  0.007296  0.005465  0.005163
 A22  0.522559  0.405968  0.003974  0.016192  0.017548  0.004371  0.006613
 A23  0.651508  0.293734  0.003454  0.008671  0.006495  0.004420  0.012690
 A24  0.608412  0.306895  0.005261  0.022785  0.012313  0.010387  0.007269
 A25  0.586648  0.396831  0.001091  0.002881  0.003370  0.001791  0.002653
 A26  0.581889  0.355270  0.005351  0.010787  0.009465  0.012801  0.007801
 A27  0.516551  0.410190  0.005050  0.017993  0.008291  0.004955  0.007690
 A28  0.599887  0.357194  0.003687  0.008658  0.003910  0.004613  0.007852
 A29  0.507340  0.408165  0.004413  0.020353  0.016572  0.005516  0.007222
 A30  0.567321  0.372151  0.005275  0.011789  0.009107  0.003837  0.014339
 C1   0.643585  0.316641  0.003021  0.006518  0.007342  0.005766  0.003745
 C2   0.541852  0.391603  0.004846  0.017364  0.007647  0.006649  0.006658
 C3   0.438754  0.517998  0.002520  0.006490  0.005874  0.006534  0.004604
 C4   0.568677  0.339401  0.004001  0.017661  0.009178  0.009823  0.016509
 C5   0.642626  0.318047  0.003111  0.005106  0.007953  0.003993  0.007378
 C6   0.631181  0.333015  0.002390  0.006908  0.003961  0.003829  0.004584
 C7   0.491950  0.483831  0.001351  0.004075  0.003003  0.002280  0.005450
 C8   0.474616  0.477119  0.003745  0.013395  0.009055  0.004028  0.005392
 C9   0.448716  0.511961  0.002592  0.006751  0.007480  0.004423  0.004653
 C10  0.544741  0.357364  0.012565  0.015990  0.009213  0.011656  0.017721
 C11  0.499674  0.450371  0.003726  0.008411  0.005574  0.005063  0.005088
 C12  0.518229  0.394939  0.005557  0.018574  0.011529  0.008770  0.012222
 C13  0.520225  0.413864  0.004188  0.012555  0.008665  0.010756  0.006817
 C14  0.487949  0.447849  0.006228  0.017722  0.008323  0.007822  0.009249
 C15  0.638558  0.333838  0.001517  0.007267  0.003201  0.002974  0.002691
 C16  0.689980  0.277872  0.002541  0.003580  0.004451  0.003287  0.004617
 C17  0.579555  0.407178  0.000657  0.003442  0.001834  0.001403  0.001637
 C18  0.703768  0.228489  0.005956  0.016919  0.007975  0.004958  0.009829
 C19  0.781555  0.174173  0.003563  0.007725  0.006524  0.003274  0.006154
 C20  0.738882  0.238279  0.002131  0.006289  0.003999  0.001629  0.002190
 C21  0.516308  0.408200  0.005390  0.019042  0.013610  0.006517  0.007339
 C22  0.501446  0.437590  0.003531  0.014603  0.008874  0.005957  0.008276
 C23  0.559623  0.389726  0.004855  0.006558  0.007310  0.005886  0.005935
 C24  0.535000  0.359075  0.008154  0.027785  0.015076  0.006721  0.022632
 C25  0.722750  0.248418  0.002050  0.003719  0.005528  0.002696  0.003729
 C26  0.680486  0.292610  0.002771  0.004564  0.005080  0.004100  0.001354
 C27  0.497896  0.470187  0.002826  0.006844  0.003649  0.003358  0.005679
 C28  0.354893  0.587241  0.006495  0.008543  0.007060  0.003655  0.006971
 C29  0.654419  0.315111  0.002209  0.005479  0.003549  0.005255  0.004096
 C30  0.504934  0.408905  0.005079  0.018343  0.012936  0.011011  0.012249

             7         8         9
 A1   0.009724  0.005484  0.003860
 A2   0.001802  0.001313  0.000667
 A3   0.008155  0.006020  0.002466
 A4   0.013697  0.012241  0.006838
 A5   0.003038  0.001220  0.001630
 A6   0.016420  0.010187  0.004839
 A7   0.008612  0.010807  0.003134
 A8   0.006237  0.007994  0.002427
 A9   0.009083  0.008639  0.002674
 A10  0.015610  0.006687  0.007003
 A11  0.008912  0.004713  0.003457
 A12  0.005284  0.004206  0.003094
 A13  0.006430  0.007646  0.004976
 A14  0.014991  0.009476  0.007767
 A15  0.003253  0.002883  0.002363
 A16  0.019629  0.005578  0.003191
 A17  0.004333  0.002290  0.003144
 A18  0.011228  0.007747  0.008266
 A19  0.019473  0.009583  0.006841
 A20  0.008595  0.008630  0.004591
 A21  0.006539  0.004365  0.002482
 A22  0.010876  0.009824  0.002077
 A23  0.011405  0.005136  0.002487
 A24  0.013981  0.005481  0.007216
 A25  0.002468  0.001164  0.001102
 A26  0.004839  0.006492  0.005304
 A27  0.012388  0.012208  0.004684
 A28  0.004833  0.005649  0.003716
 A29  0.016491  0.008608  0.005320
 A30  0.005961  0.006901  0.003319
 C1   0.006847  0.004628  0.001906
 C2   0.009491  0.007138  0.006752
 C3   0.009893  0.004796  0.002537
 C4   0.024058  0.007688  0.003005
 C5   0.004645  0.003625  0.003516
 C6   0.004525  0.005740  0.003866
 C7   0.003467  0.003187  0.001407
 C8   0.006733  0.003926  0.001990
 C9   0.003413  0.006241  0.003770
 C10  0.010507  0.013290  0.006953
 C11  0.009252  0.004718  0.008124
 C12  0.014652  0.009050  0.006478
 C13  0.012730  0.005277  0.004921
 C14  0.004925  0.005170  0.004763
 C15  0.003657  0.004484  0.001813
 C16  0.008474  0.002281  0.002918
 C17  0.002050  0.001318  0.000927
 C18  0.007230  0.008139  0.006737
 C19  0.006115  0.006883  0.004035
 C20  0.003231  0.002517  0.000854
 C21  0.013514  0.006236  0.003844
 C22  0.010940  0.003807  0.004975
 C23  0.009127  0.008344  0.002635
 C24  0.013967  0.007350  0.004240
 C25  0.005951  0.002420  0.002739
 C26  0.004001  0.002438  0.002597
 C27  0.004088  0.002651  0.002821
 C28  0.010722  0.010474  0.003946
 C29  0.005433  0.001959  0.002490
 C30  0.013142  0.006200  0.007201  ,
        causal  spurious
 A1   0.919637  0.080363
 A2   0.981292  0.018708
 A3   0.963490  0.036510
 A4   0.942143  0.057857
 A5   0.969169  0.030831
 A6   0.920049  0.079951
 A7   0.937307  0.062693
 A8   0.912605  0.087395
 A9   0.960553  0.039447
 A10  0.927247  0.072753
 A11  0.970916  0.029084
 A12  0.951627  0.048373
 A13  0.957703  0.042297
 A14  0.913393  0.086607
 A15  0.987047  0.012953
 A16  0.939060  0.060940
 A17  0.988850  0.011150
 A18  0.945254  0.054746
 A19  0.946158  0.053842
 A20  0.917838  0.082162
 A21  0.954182  0.045818
 A22  0.949843  0.050157
 A23  0.955464  0.044536
 A24  0.956205  0.043795
 A25  0.981477  0.018523
 A26  0.954817  0.045183
 A27  0.905737  0.094263
 A28  0.984437  0.015563
 A29  0.948635  0.051365
 A30  0.952422  0.047578
 C1   0.963725  0.036275
 C2   0.911030  0.088970
 C3   0.933730  0.066270
 C4   0.955408  0.044592
 C5   0.941797  0.058203
 C6   0.954146  0.045854
 C7   0.977829  0.022171
 C8   0.944057  0.055943
 C9   0.959542  0.040458
 C10  0.920482  0.079518
 C11  0.926628  0.073372
 C12  0.900053  0.099947
 C13  0.922272  0.077728
 C14  0.927123  0.072877
 C15  0.977257  0.022743
 C16  0.972236  0.027764
 C17  0.985493  0.014507
 C18  0.962885  0.037115
 C19  0.948411  0.051589
 C20  0.980467  0.019533
 C21  0.915580  0.084420
 C22  0.941026  0.058974
 C23  0.965293  0.034707
 C24  0.963340  0.036660
 C25  0.964938  0.035062
 C26  0.976311  0.023689
 C27  0.976079  0.023921
 C28  0.968024  0.031976
 C29  0.983531  0.016469
 C30  0.949127  0.050873)
adata_protein = sc.AnnData(X=microb.T)
adata_protein.var_names = microb_df.index
adata_protein.obs['labels_ori'] = labels.values
adata_protein.obs['labels'] = labels.apply(lambda tg: 1 if tg == labels[0] else 0)
adata_protein.obsm['X_ct_1'] = model_1L.get_model_output()['latent'][:,:2]
adata_protein.obsm['X_ct_2'] = model_2L.get_model_output()['latent'][:,:2]
sc.pp.neighbors(adata_protein)
WARNING: You’re trying to run this on 74 dimensions of `.X`, if you really want this, set `use_rep='X'`.
         Falling back to preprocessing with `sc.pp.pca` and default params.
sc.tl.umap(adata_protein)
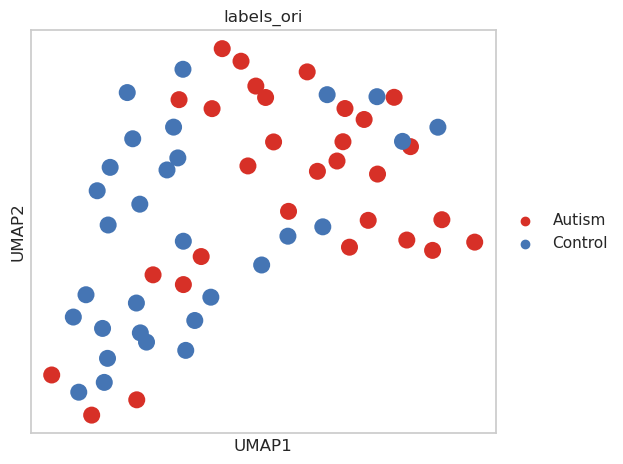
sc.pl.umap(adata_protein, color='labels_ori', palette={"Autism": "#D73027", "Control": "#4575B4"}, show=False, size=600)
plt.tight_layout()
plt.savefig(os.path.join(output_dir, 'umap.pdf'))
Calculate causal/non-causal features contribution to PC loadings#
from sklearn.decomposition import PCA


# X: shape (n_samples, n_genes)
pca = PCA(n_components=20)
pca.fit(adata_layer2.X)

loadings = pca.components_.T  # shape: (n_genes, 2)

df = pd.DataFrame(loadings[:, :2], columns=['PC1', 'PC2'], index=adata_layer2.var_names)

df['PC1_abs'] = np.abs(df['PC1'])
df['PC2_abs'] = np.abs(df['PC2'])

top_PC1 = df.sort_values('PC1_abs', ascending=False).head(10)
top_PC2 = df.sort_values('PC2_abs', ascending=False).head(10)
adata_layer2pca = pca.transform(adata_layer2.X)
import seaborn as sns
import matplotlib.pyplot as plt
import pandas as pd
from scipy.stats import mannwhitneyu
import numpy as np
sns.set(style="whitegrid", palette="pastel")
k = 5
df = pd.DataFrame(adata_layer2pca[:, :k], columns=[f'PC{i+1}' for i in range(k)])
df['Group'] = adata_layer2.obs['labels_ori'].values
n_cols = 2
n_rows = int(np.ceil(k / n_cols))
fig, axes = plt.subplots(n_rows, n_cols, figsize=(6*n_cols, 5*n_rows), sharey=True)
axes = axes.flatten()
palette = {"Autism": "#D73027", "Control": "#4575B4"}
for i, ax in enumerate(axes):
if i >= k:
ax.axis('off')
continue
pc_name = f'PC{i+1}'
sns.boxplot(
x='Group',
y=pc_name,
data=df,
ax=ax,
palette=palette,
width=0.6,
showfliers=False
)
sns.swarmplot(
x='Group',
y=pc_name,
data=df,
ax=ax,
color='black',
alpha=1,
size=3
)
group1 = df[df['Group'] == df['Group'].unique()[0]][pc_name]
group2 = df[df['Group'] == df['Group'].unique()[1]][pc_name]
_, p_value = mannwhitneyu(group1, group2)
y_max = df[pc_name].max()
h = y_max * 0.05
ax.plot([0, 0, 1, 1], [y_max+h, y_max+2*h, y_max+2*h, y_max+h], lw=1.5, c='k')
if p_value < 0.001:
symbol = '***'
elif p_value < 0.01:
symbol = '**'
elif p_value < 0.05:
symbol = '*'
else:
symbol = 'ns'
ax.text(0.5, y_max+2.5*h, symbol, ha='center', va='bottom', color='k')
ax.set_title(pc_name, fontweight='bold')
ax.set_xlabel('')
ax.tick_params(axis='x', rotation=45)
axes[0].set_ylabel('PC Value', fontweight='bold')
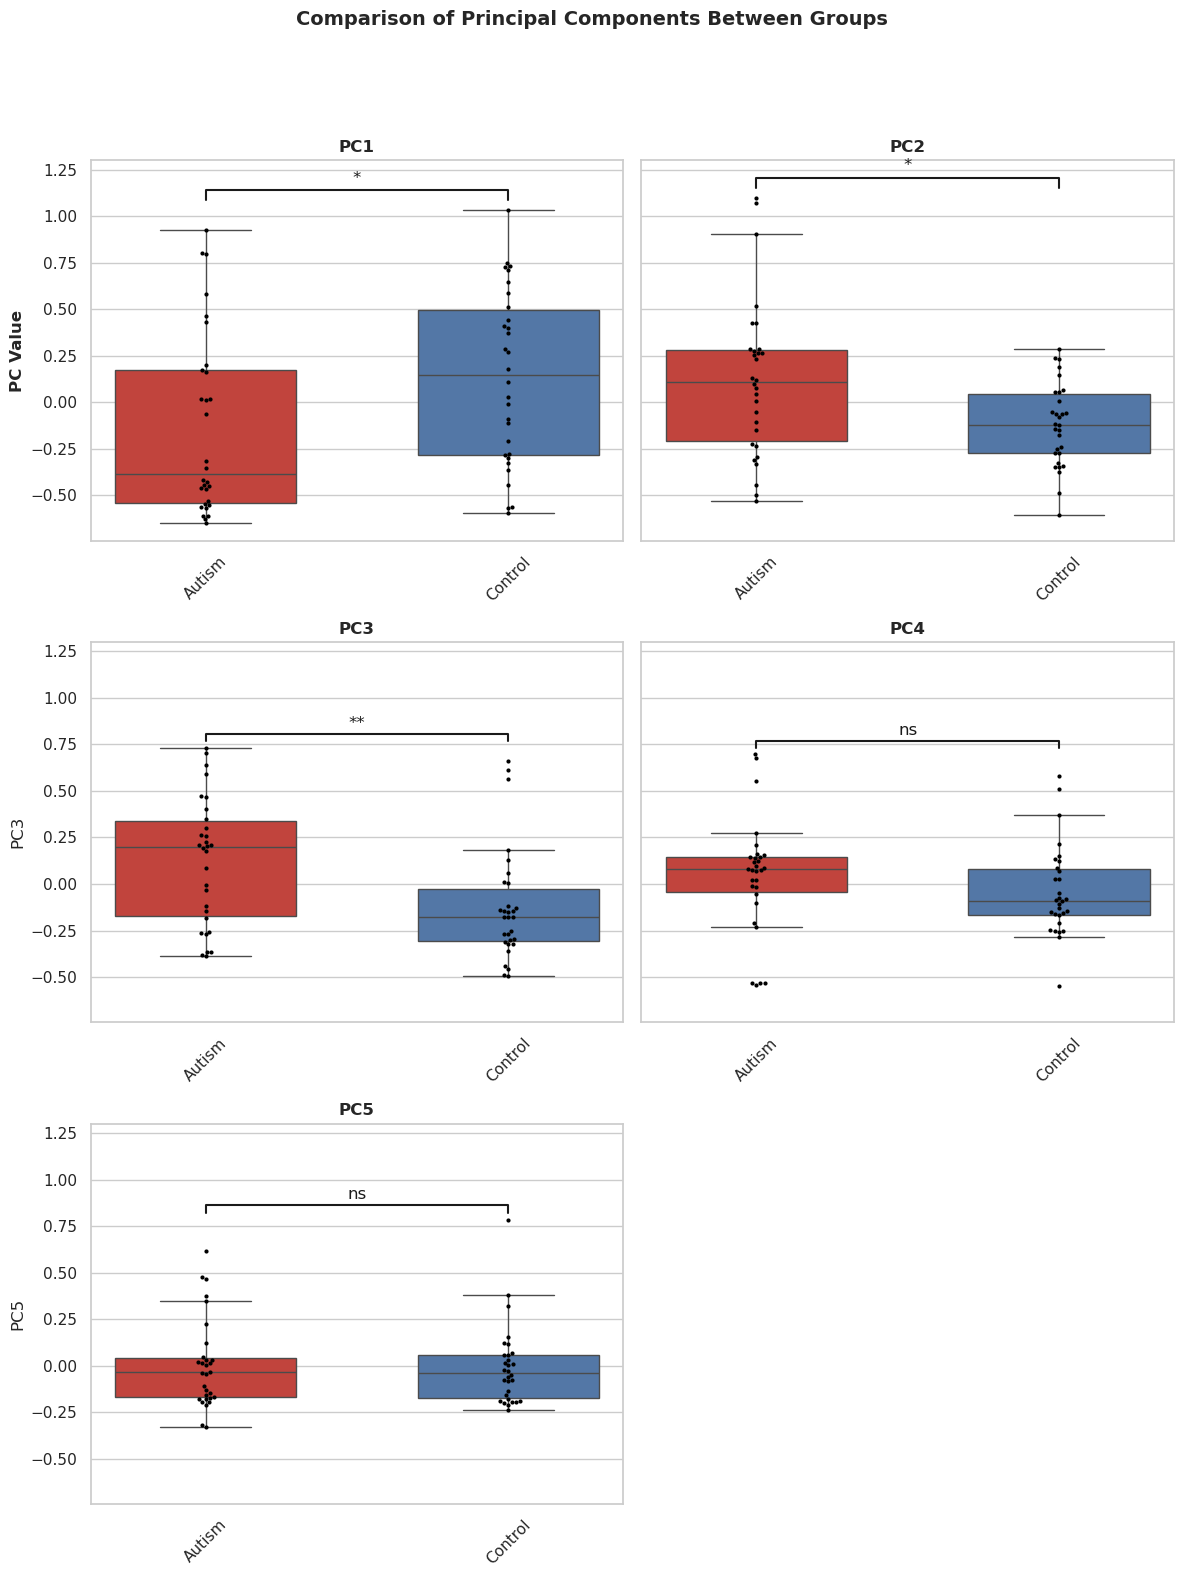
plt.suptitle('Comparison of Principal Components Between Groups', y=1.05, fontsize=14, fontweight='bold')
plt.tight_layout()
plt.savefig(output_dir+'compare_PC1-5.pdf')
plt.show()
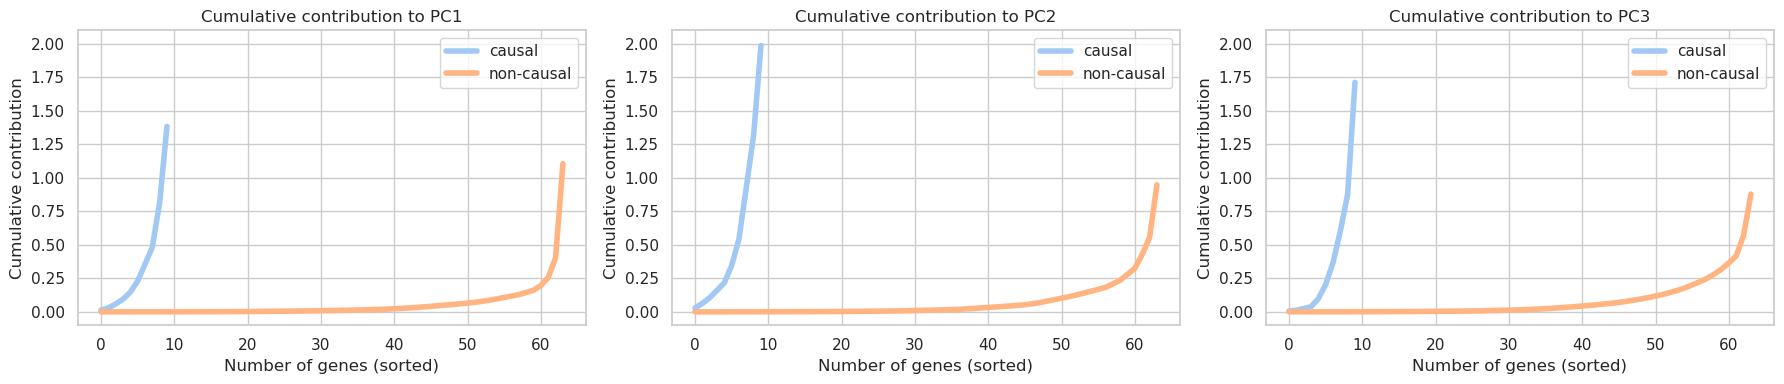
def plot_cumulative_contributions(pca, k=2, figsize=(6, 4)):
    loading_dict = {
        f'PC{i+1}_loading': np.abs(pca.components_[i])
        for i in range(k)
    }
    df = pd.DataFrame({
        'gene': adata_layer2.var_names,
        'group': ['causal' if g in df_layer2.head(10).index else 'non-causal' for g in adata_layer2.var_names],
        **loading_dict
    })

    fig, axes = plt.subplots(1, k, figsize=(figsize[0]*k, figsize[1]))

    if k == 1:
        axes = [axes]
    for i in range(k):
        pc_col = f'PC{i+1}_loading'
        curves = {}

        for group in df['group'].unique():
            subset = df[df['group'] == group].copy()
            sorted_vals = np.sort(subset[pc_col].values)
            cum = np.cumsum(sorted_vals)
            curves[group] = cum

        ax = axes[i]
        for group, cum in curves.items():
            x = np.arange(len(cum))
            ax.plot(x, cum, label=group, linewidth=4)

        ax.set_title(f"Cumulative contribution to PC{i+1}")
        ax.set_xlabel("Number of genes (sorted)")
        ax.set_ylabel("Cumulative contribution")
        ax.set_ylim(-0.1, 2.1)
        ax.legend()
        ax.grid(True)

    plt.tight_layout()
    plt.savefig(output_dir + 'cum_PC.pdf')
    plt.show()

plot_cumulative_contributions(pca, k=3)
Significance testing for candidate triggers (permutation)#
adata_layer2.var_names.get_indexer(df_layer2.head(10).index)
array([59, 39, 19, 63, 37, 0, 38, 49, 64, 30])
# ======================================================
# SHAP → 全局置换检验(Global Permutation)
# ======================================================
df_shap_global, _ = model_2L.get_up_significance(
    method="SHAP",
    test_mode="permutation",
    perm_mode="global",
    n_perm=50,
    n_bg_samples=60,
    use_signed=True,
    fdr_correct=False,
    show_progress=True,
    random_state=0,
)
[Note] SHAP-based significance computed via permutation test (global mode, 50 permutations).
print("df_shap_global: ", df_shap_global.iloc[[59, 39, 19, 63, 37, 0, 38, 49, 64, 30],:])
df_shap_global:                      weight  weight_signed    pvalue
Faecalibacterium  0.230254       0.004772  0.039216
Blautia           0.103730      -0.000170  0.549020
Akkermansia       0.087225      -0.003126  0.588235
Subdoligranulum   0.055883       0.000332  0.176471
Agathobacter      0.055594       0.000536  0.039216
Bacteroides       0.039992       0.001156  0.196078
Anaerostipes      0.036346      -0.000194  0.568627
Roseburia         0.026183      -0.000416  0.137255
Catenibacterium   0.022002       0.000731  0.352941
Streptococcus     0.019853       0.000369  0.176471
In-silico perturbation of significant triggers#
adata_TF = adata_layer2.copy()
adata_down = X_down.copy()
adata_down.obsm['X_umap'] = adata_protein.obsm['X_umap']
dot_size = 800
pert_Gene = ['Faecalibacterium', 'Roseburia']
fold = [2, 2]
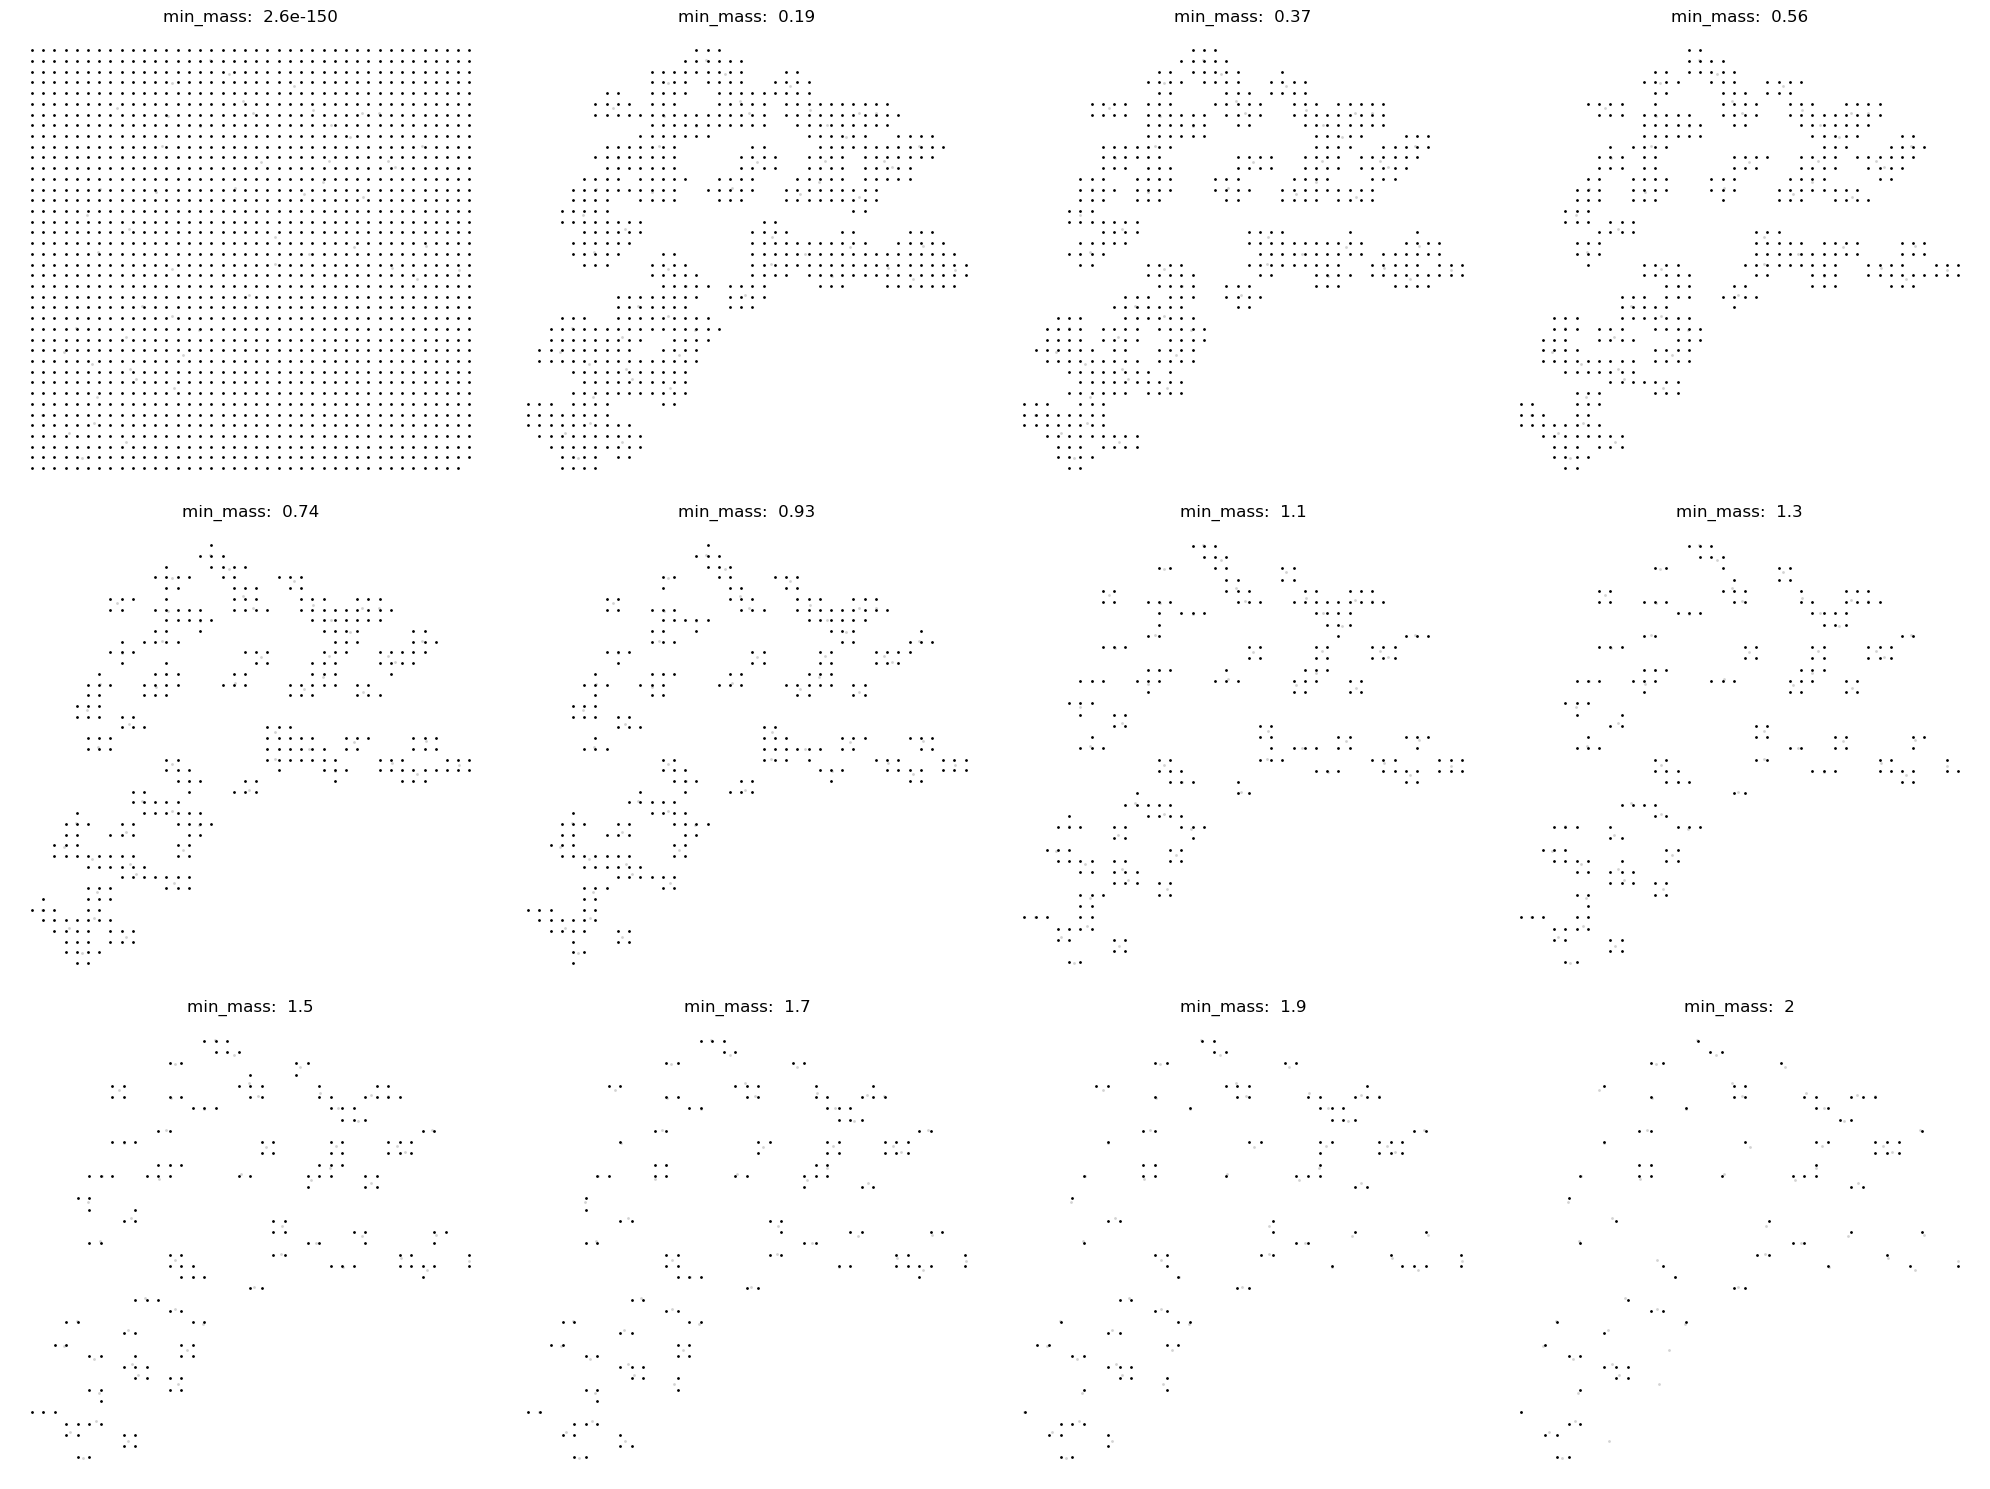
_ = pert_plot_stream(adata_TF, adata_down, model_2L, pert_Gene,n_neighbors=None,scale=30,pert_celltype=['Autism'],run_suggest_mass_thresholds=True,fold=fold,state_obs='labels_ori', dot_size=dot_size, min_mass=1.3,embedding_name='X_umap')
dot_size = 800
pert_Gene = ['Faecalibacterium']
fold = [5]
model_output_pert1 = pert_plot_stream(
    adata_TF, adata_down, model_2L,
    pert_Gene,
    n_neighbors=None,
    scale=30,
    pert_celltype=['Autism', 'Control'],
    run_suggest_mass_thresholds=False,
    fold=fold,
    state_obs='labels_ori',
    dot_size=dot_size,
    min_mass=1.9,
    embedding_name='X_umap',
    palette={"Autism": "#D73027", "Control": "#4575B4"},
    save_dir=output_dir
)